반응형
Matplot Chart 가 파이썬 Tkinter 안에 삽입되어야 하는 경우
Matplot Chart 를 생성한 후에 ( 예제는 padas DataFrame를 사용하여 데이터를 생성 )
Matplot Chart의 결과를 tkinter 의 canvas 객체에 그려 주면 된다.
import tkinter as tk
from pandas import DataFrame
import matplotlib.pyplot as plt
from matplotlib.backends.backend_tkagg import FigureCanvasTkAgg
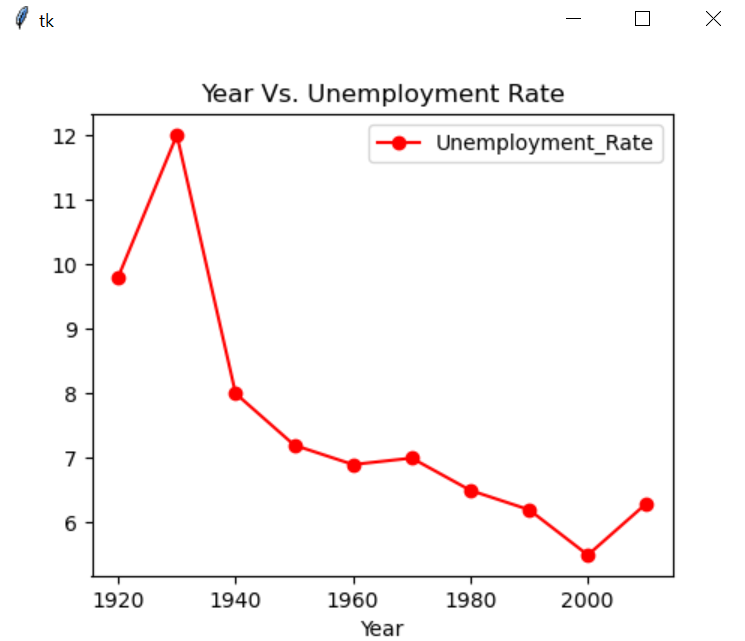
data2 = {'Year': [1920,1930,1940,1950,1960,1970,1980,1990,2000,2010],
'Unemployment_Rate': [9.8,12,8,7.2,6.9,7,6.5,6.2,5.5,6.3]
}
df2 = DataFrame(data2,columns=['Year','Unemployment_Rate'])
root= tk.Tk()
figure2 = plt.Figure(figsize=(5,4), dpi=100)
ax2 = figure2.add_subplot(111)
line2 = FigureCanvasTkAgg(figure2, root)
line2.get_tk_widget().pack(side=tk.LEFT, fill=tk.BOTH)
df2 = df2[['Year','Unemployment_Rate']].groupby('Year').sum()
df2.plot(kind='line', legend=True, ax=ax2, color='r',marker='o', fontsize=10)
ax2.set_title('Year Vs. Unemployment Rate')
root.mainloop()df2 = plot 될 데이터 틀(DataFrame)
ax2 = 데이터가 그려질 GUI 창(Tkinter Cavas)
참고 : https://datatofish.com/matplotlib-charts-tkinter-gui/
How to Place Matplotlib Charts on a Tkinter GUI - Data to Fish
Often times, you may need to place matplotlib charts on a tkinter GUI. This feature is especially useful for users who deal with front-end GUIs. And so, in this tutorial, I’ll show you the steps to place matplotlib charts on a tkinter GUI. More specific
datatofish.com
반응형
'프로그래밍 > PYTHON' 카테고리의 다른 글
| [python]파이썬_Tkinter_리스트박스 옆 스크롤바(Listbox,Scrollbar) (0) | 2020.07.31 |
|---|---|
| [Python]파이썬_Tkinter_동영상재생(OpenCV, Tkinter, 웹캠) (0) | 2020.07.29 |
| [Python]파이썬_OpencvMat_Tkinter 연결 (0) | 2020.07.22 |
| [Python] 파이썬 프로그램 배포시 인증키(시디키,키맵)삽입 (0) | 2020.07.17 |
| 2. 파이썬 UDP 소켓 통신(PYTHON UDP SOCKET PROGRAM) (1) | 2019.11.14 |


